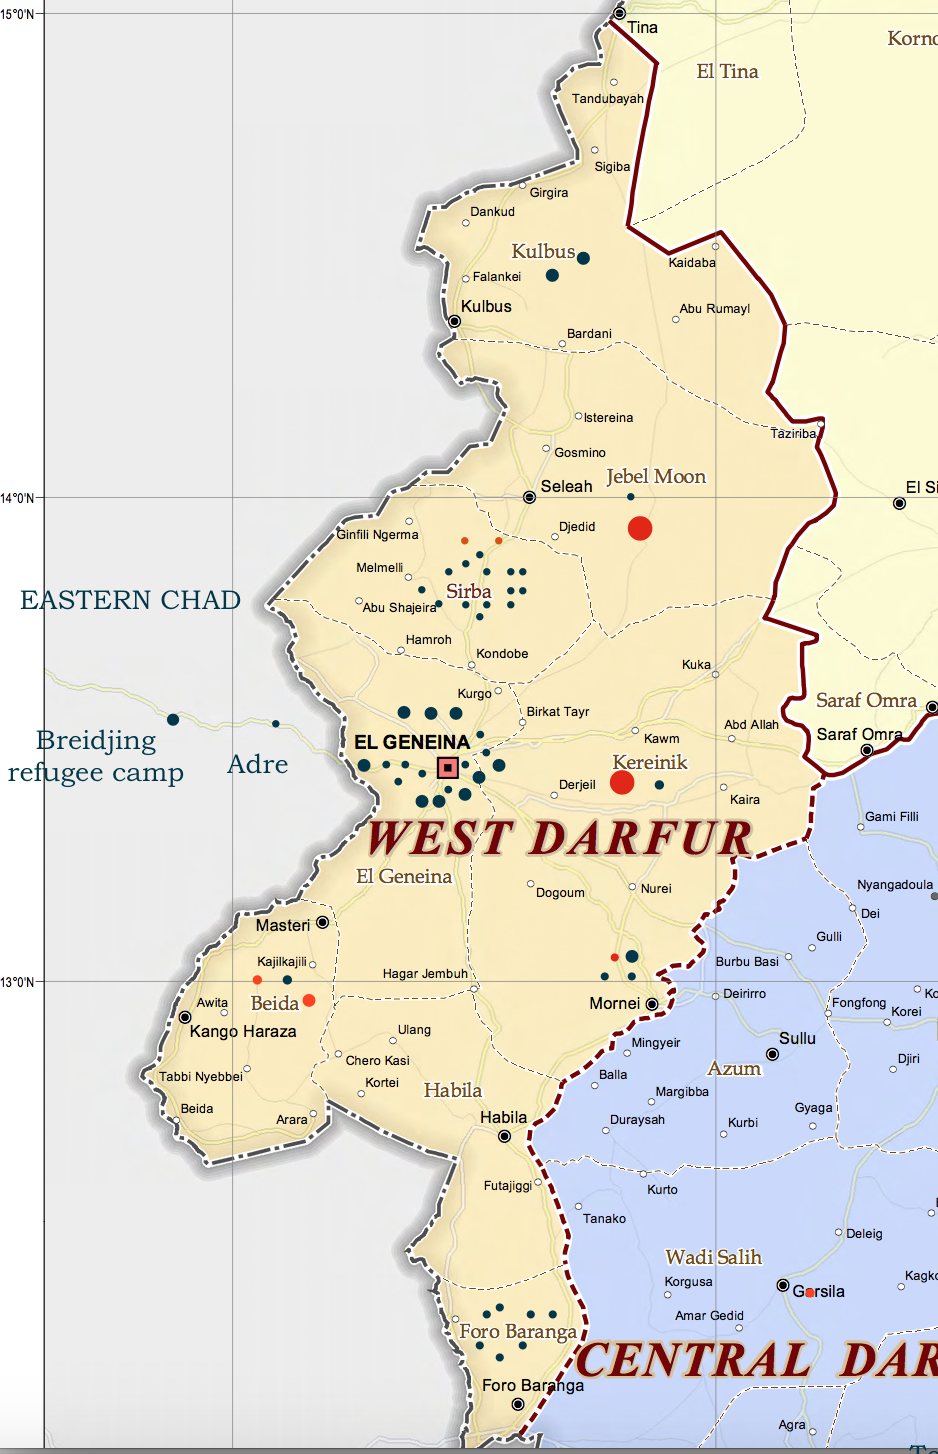
The key for the maps is as follows:
Black dots (circles) of 50pt size represent events with a scaled violence rating of 1 – 5;
Red dots of 50pt size represent events with a scaled violence rating of 6 – 10;
Black dots of 75pt size represent events with a scaled violence rating of 11 – 25;
Red dots of 75pt size represent events with a scaled violence rating of 26 – 50;
Large red dots of 200pt size represent events with a scaled violence rating of more than 50 (these are primarily used to represent inter-tribal violence among Arab groups in East Darfur and large-scale civilian displacement by military assaults)
For a full explanation of how these figures are derived, see the report’s concluding comment, THE NATURE OF THE DATA UNDERLYING THIS REPORT.
